You are using an unsupported browser. Please update your browser to the latest version on or before July 31, 2020.
close
You are viewing the article in preview mode. It is not live at the moment.
IMPORTANT: Upcoming Changes in CAREWare > Learn More
Home > Client Records > Client Summary
Client Summary
print icon
 

Purpose

Create a concise client dashboard that brings important data points, report fields, and graphs into one view.

Who should do this

CAREWare administrators and authorized users who design or manage Client Summaries.

Use this guide when you need to

Create a Client Summary, add report-field controls and labels, or add a quantitative lab graph.

Main warning

Only one Client Summary can be active for a provider at a time. Assigning another summary replaces the active one.


Quick path
Administrative Options > Custom Features > Client Summary Designer


Important
CAREWare can contain several Client Summaries, but only one can be active for a provider at a time.

Before you begin

  • Confirm that the appropriate permissions are granted in Central Administration, the provider domain, and the user account.
  • Grant View Client Summaries so users can view the summary in client records.
  • Grant Manage Client Summaries so authorized users can create or edit summaries.

Open Client Summary Designer

Step 1. Click Administrative Options.

Step 2. Click Custom Features.

Step 3. Click Client Summary Designer.
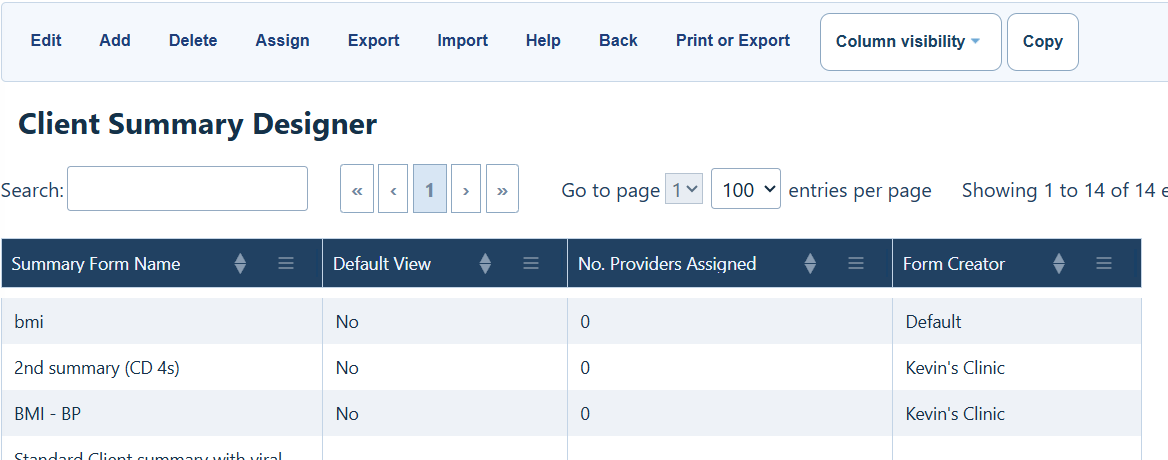
Client Summary Designer buttons

Button

What it does

Edit

Opens the selected summary in Design View.

Add

Creates a new Client Summary.

Delete

Deletes the selected Client Summary.

Assign

Activates the selected summary for a provider and deactivates the previously assigned summary.

Export

Exports a Client Summary design as a file that can be imported into CAREWare.

Import

Imports a Client Summary design from a CAREWare JSON file.

Help

Opens the Knowledge Base article for the Client Summary Designer.

Back

Returns to Custom Feature Setup.

Print or Export

Opens the print screen for the list of summaries.

Column Visibility

Hide or show columns in the view.


Create a Client Summary

Step 1. Click Add.

Step 2. Enter a name for the Client Summary.

Step 3. Click Add.

Step 4. Click Add Control.
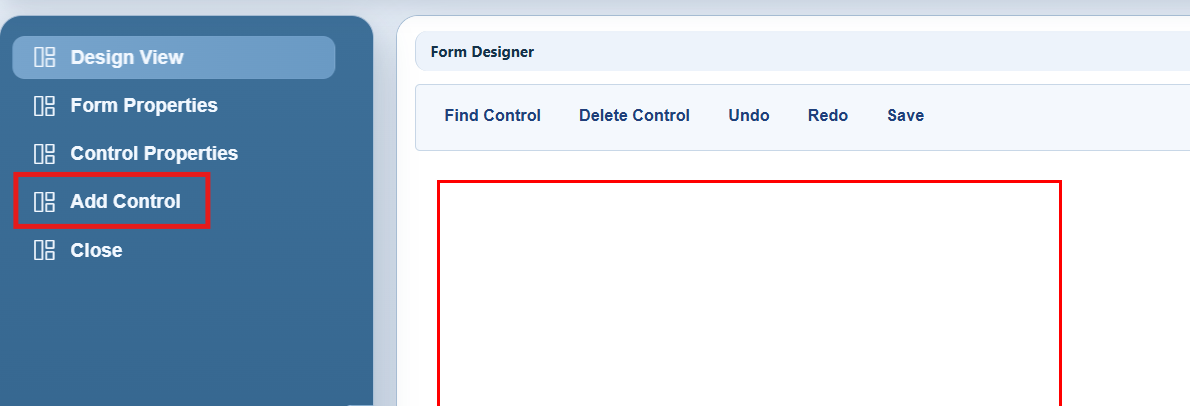
Design View controls

Control

What it does

Design View

Returns to the summary design page.

Form Properties

Edits the design name and description.

Control Properties

Edits properties for the selected control.

Add Control

Lists controls that can be added from Custom Report Fields.

Close

Closes the form.

Find Control

Searches controls currently added to the form.

Delete Control

Deletes the selected control.

Undo / Redo

Reverts the last action or restores an action that was undone.

Save

Saves the form.


Add a demographic report field

Step 1. Click Add Demographic Report Field.

Step 2. Type the field name in the Search box.

Step 3. Select the Field Name.

Step 4. Click Add.

Step 5. Click Back.

Step 6. Drag the field to the desired location.
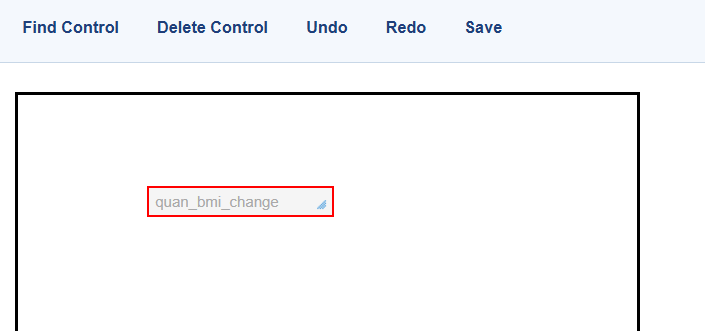
Add a label

Labels identify controls on the Client Summary. Add the label after placing the report field.

Step 1. Click a blank area of the page to select the page.

Step 2. Click Add Control.

Step 3. Click Add Doodad.

Step 4. Click Label.

Step 5. Click Add.
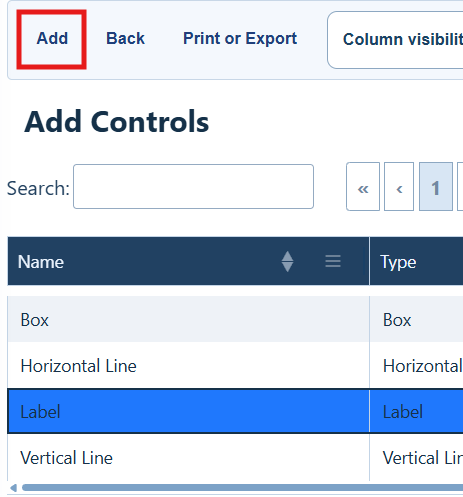
 

Step 6. Drag the label to the desired location.
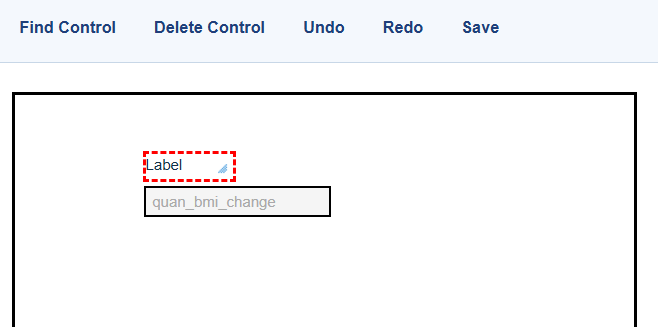
Edit the label text

Step 1. Click Control Properties.

Step 2. Click Text.

Step 3. Enter the label text in the Value box.
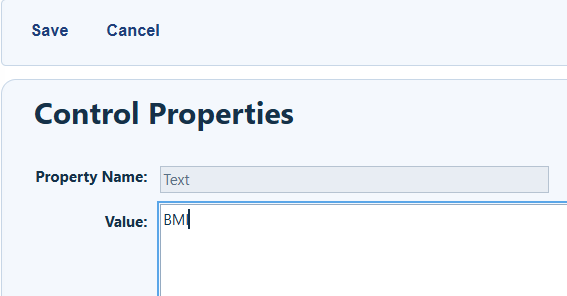
Step 4. Click Save.

Step 5. Click Back.

Add a quantitative lab graph
Step 1. Click Add Control.

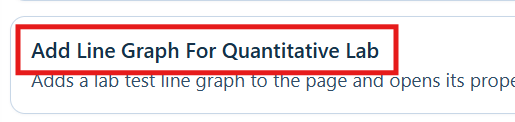
Step 2. Click Add Line Graph for Quantitative Lab.
Select the lab definition

Step 3. Select CD4 Count from the Lab Definition list.
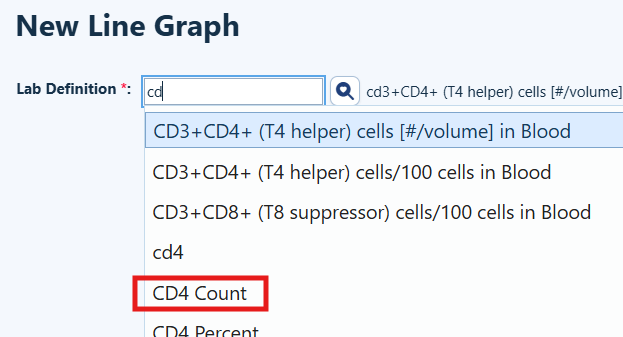
Step 4. Click Next.

Step 5. Click Back.


Step 6. Drag the CD4 Count graph to the desired location.
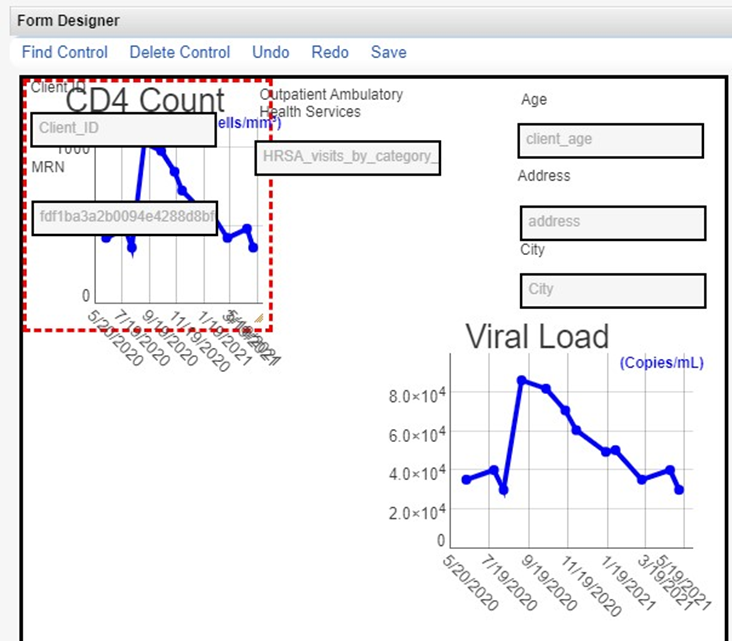
Step 7. Click Save.

Verification
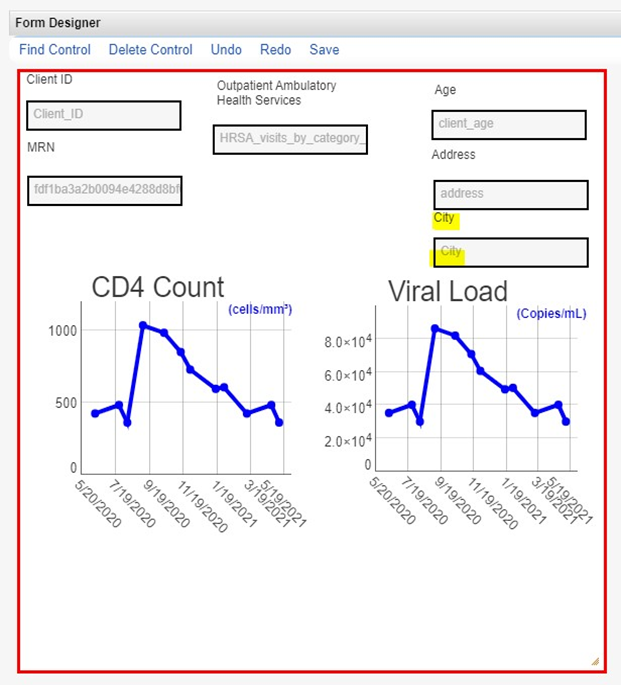
In this example, the CD4 Count graph shows the client’s CD4 Count records from Labs. The City field displays the client’s City from Demographics under Contact Information.

How to confirm it worked

  The intended Client Summary appears in the client record.

  The report fields display values from the expected client record areas.

  The lab graph displays records from the selected lab definition.

  Only the intended summary is active for the provider.

Troubleshooting and common questions

Why is the chart blank? – Confirm that the client has labs entered. Open the client record and click Labs in the left menu.

Can the colors be changed? – Yes. Color options are located under Control Properties.

Related References

Document

Use it for

Form Designer

Overview, planning guidance, key terms, and permissions.


Feedback
0 out of 0 found this helpful

Attachments

CAREWare_User_Guide__Client_Summary.pdf
scroll to top icon