
 2062
2062
|
Purpose |
Create, format, filter, run, and validate a CAREWare custom report that answers a defined reporting or data-quality question. |
|
Who should do this |
CAREWare administrators, data managers, report builders, or designated staff with Custom Reports permissions. |
|
Use this setup when |
A provider needs a reusable client list, detailed record report, aggregate or crosstab summary, data-quality review, or report-based export. |
|
Main warning |
Report type, date span, critical date, filters, totals, and provider scope all affect the results. Validate the report before sharing or using counts for submission. |
|
Video walkthrough |
Quick path
|
Reports > Custom Reports > Manage/Run Custom Reports > Add |
Before you begin
- Verify that the user has Run Custom Report, Add/Edit Report Definition, Add/Edit Selection, and Add/Edit Filter permissions as needed.
- Define the question first: identify the report type, output fields, quality-check fields, and the client or record criteria that define the sample.
- Use Central Administration when the report must include multiple provider domains, and confirm the selected provider scope before running it.
- Start with a short date span and a small group of known records so the first results are easier to validate.
|
Important A Demographics report generally produces one row per client. Record-based report types, such as Service, Lab, or Eligibility, can produce several rows for the same client because each matching record is listed. |
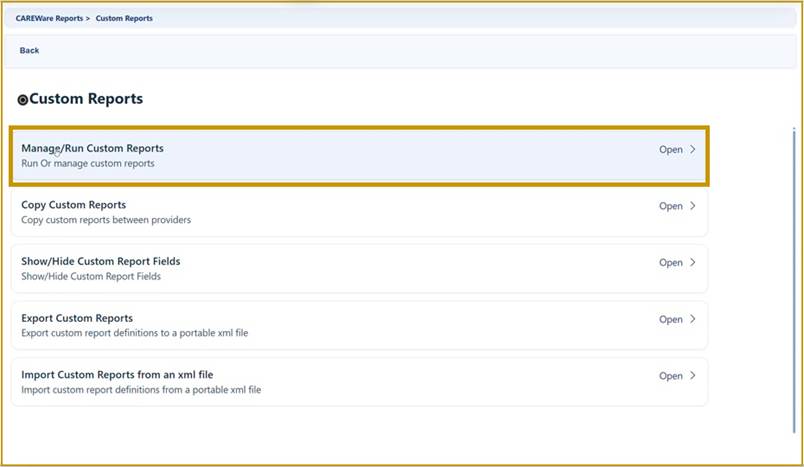
Open Custom Reports
Step 1. Click Reports.
Step 2. Click Custom Reports.
Step 3. Open Manage/Run Custom Reports.
Step 4. Click Add to start a new report definition.
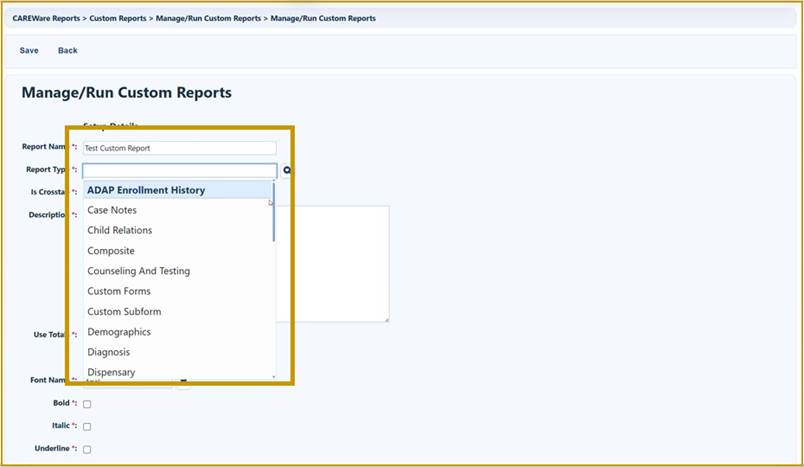
Create the report definition
Step 5. Enter a clear Report Name.
Step 6. Open Report Type and select the record type that matches the reporting question.
Step 7. Enter a Description that identifies the purpose, population, and important date logic.
Step 8. Set optional layout choices, such as Is Crosstab, Use Totals, and header or footer formatting.
Step 9. Click Save.
|
Important The report type determines which field selections and report filters are available. Choose the report type before building fields and filters; changing it later can require the report definition to be rebuilt. |
Review the report workspace
Step 10. Confirm that the report workspace shows Run Report, Report Layout, Field Selection, and Report Filter.
Report setup options
|
Option |
What it does |
Guidance |
|
Report Type |
Defines the record set and available fields and filters. |
Match the report type to the event or client-level data being reviewed. |
|
Is Crosstab |
Produces a count or percentage table instead of a standard detail list. |
The first field becomes the row, the second the column, and the third the strata. |
|
Read Only |
Prevents users from editing the report definition. |
Use after testing when the definition should be protected. |
|
Use Totals |
Combines records according to Group By, Count, Sum, and other total settings. |
Review grouping fields carefully so totals do not hide unexpected duplicates. |
|
Header/Footer format |
Controls the font, emphasis, size, and color of report header or footer text. |
Keep report titles and specifications readable when exported to PDF or printed. |
|
Tip Use a durable report name that identifies the subject and purpose. Avoid temporary names such as “Test” once the report is ready for production use. |
Add field selections
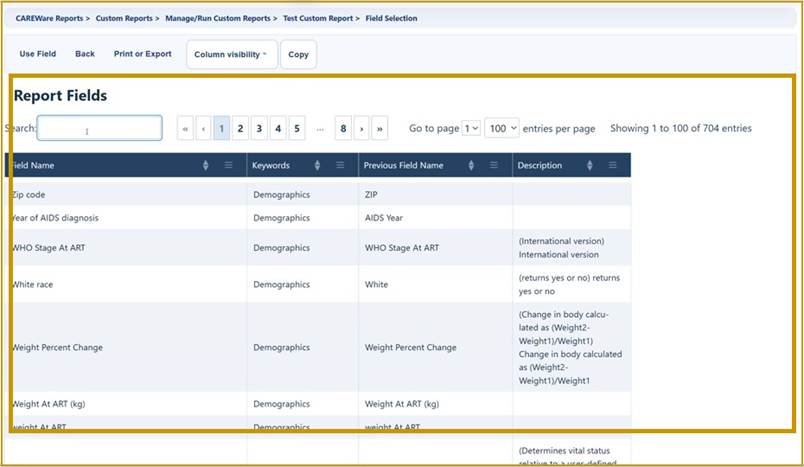
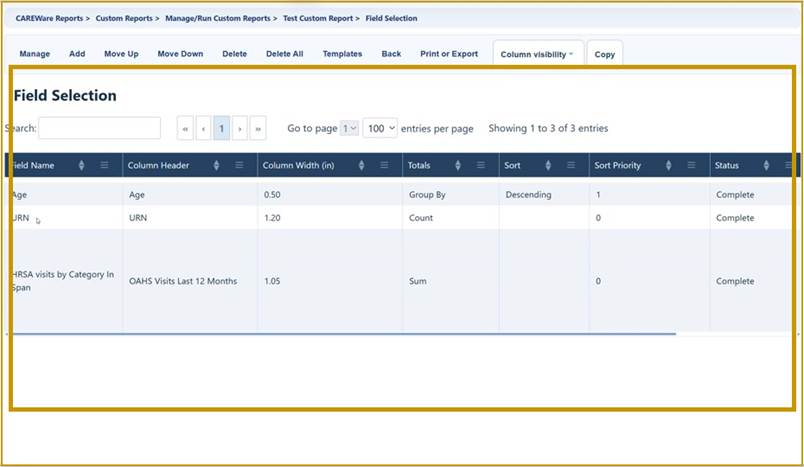
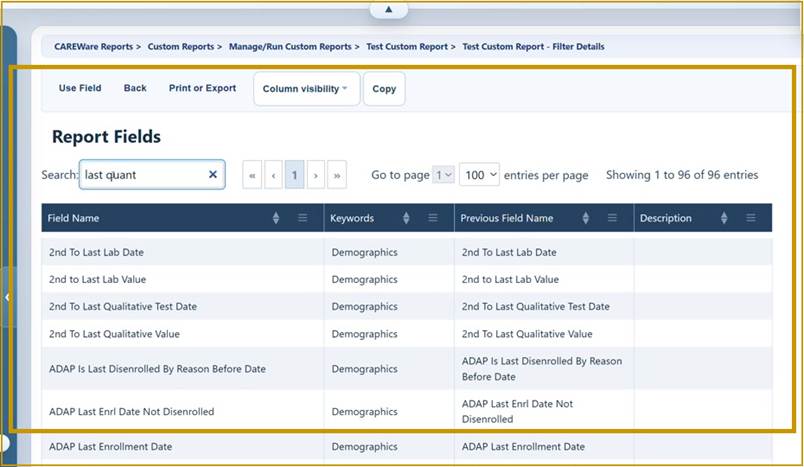
Step 11. Open Field Selection.
Step 12. Click Add.
Step 13. Enter a field name or keyword in Search to narrow the list.
Step 14. Select the field, then click Use Field.
|
Tip Include a stable identifier, the fields needed to answer the question, and one or more quality-check fields that help explain unexpected results. |
Format and order each field
Step 15. Edit the Column Header, Total, Sort, Sort Priority, width, and display formatting as needed.
Step 16. Click Save, then repeat for each field. Use Move Up or Move Down to set the final column order.
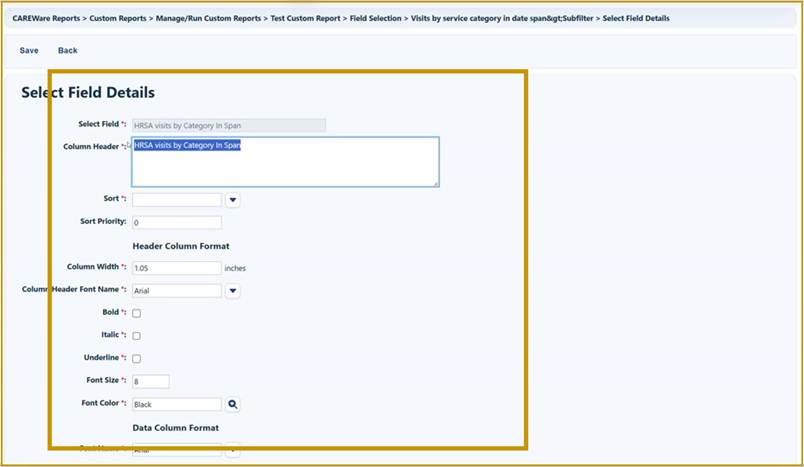
Common field settings
|
Setting |
What it controls |
|
Column Header |
The label displayed in the report output. |
|
Total |
A grouping or calculation such as Group By, Count, or Sum. |
|
Sort |
Ascending or descending order for the field. |
|
Sort Priority |
The sequence in which multiple sorted fields are applied. |
|
Column Width |
The displayed width of the report column. |
|
Field Justification |
Left, center, or right alignment of the field values. |
|
Warning Selecting a Field Selection template can replace the fields already listed in the report. Export or document the current definition before applying a template to an established report. |
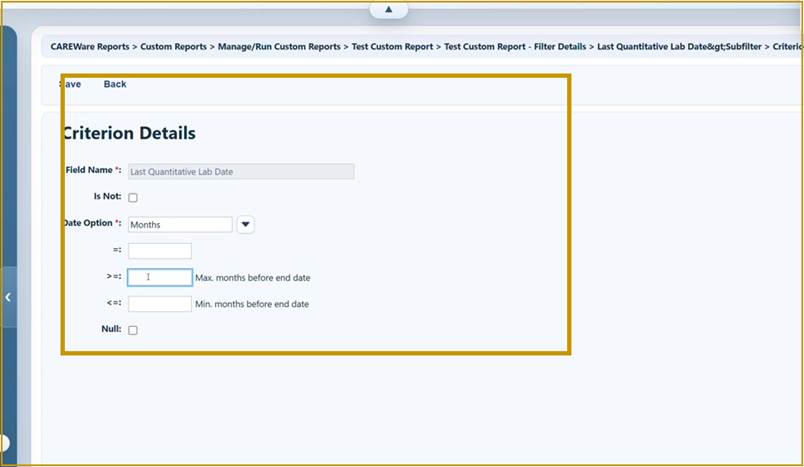
Configure a field subfilter
Some field selections include a Subfilter that defines the records used to calculate or display that field.
Step 17. Select a field that includes a Subfilter option.
Step 18. Complete each required subfilter criterion, such as service category, date option, or provider.
Step 19. Continue through the field setup and click Save.
Step 20. Review the field summary to confirm the subfilter description is correct.
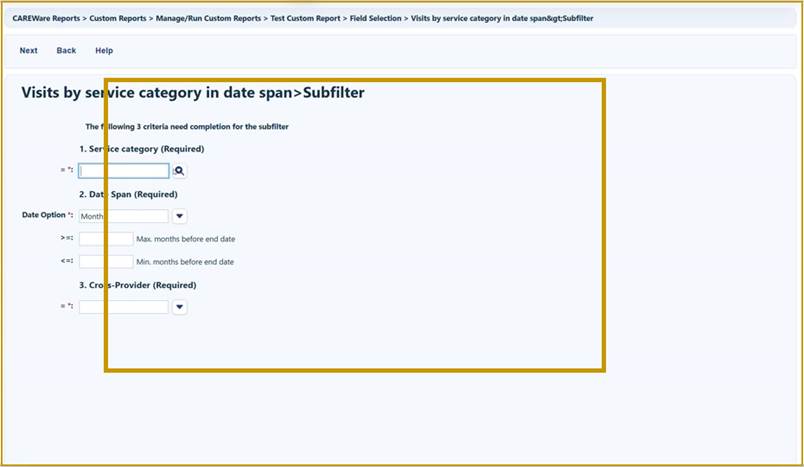
|
Important A field subfilter controls how that field is calculated. A Report Filter controls which rows or clients are included in the report. Review both when a result is unexpectedly high, low, or blank. |
For a focused walkthrough, see Creating a Subfilter.
Create a numeric grouping
Numeric fields can be grouped into labeled ranges. The video demonstrates this with Age.
Step 21. Open the numeric field and select Number Format.
Step 22. Click Add and enter a Group Description.
Step 23. Open Number Items and click Add.
Step 24. Enter the Max. Value and the label for the range.
Step 25. Repeat until all required ranges are defined.
Step 26. Save the group and apply the number-format template to the field.
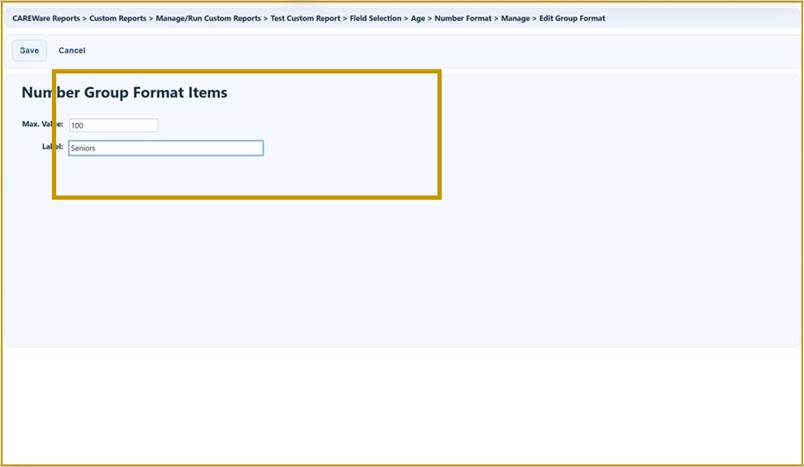
|
Important Each Max. Value closes one range and the next range begins above it. Test boundary values and confirm the ranges cover every expected value without gaps or unintended categories. |
Review the report layout
Step 27. Open Report Layout.
Step 28. Confirm the report name, report type, crosstab setting, description, Read Only setting, and Use Totals setting.
Step 29. Save any changes, then return to the report workspace.
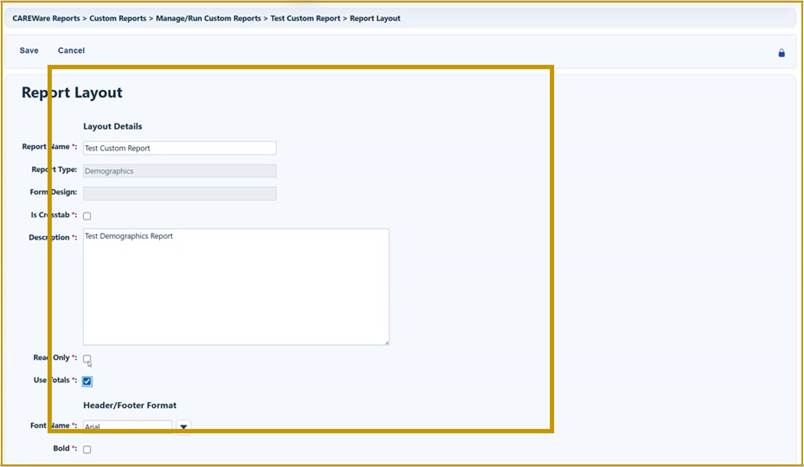
|
Tip Use Crosstab for counts or percentages by category. Use a standard detail report when staff must review individual client or record values. |
Review totals, sorting, and field order
Step 30. Return to Field Selection and confirm the column order, widths, totals, sorting, and status for every field.
Using totals safely
- Use Group By for fields that define the distinct rows in the output.
- Use Count to count matching records or identifiers and Sum only for numeric values that should be added.
- Run the report once without totals when necessary to understand which source records are being combined.
- Confirm whether the resulting count is duplicated by client, by record, or unduplicated across providers.
|
Warning A report can look correct while using the wrong level of detail. Compare totals with a small known sample and inspect the underlying record rows before relying on an aggregate count. |
Add report filters
Step 31. Open Report Filter and click Add.
Step 32. Search for the field that defines the population or record criteria.
Step 33. Select the field and click Use Field.
|
Tip Use the report filter to define who or what is included. Do not add a filter merely to display a field; add the field under Field Selection instead. |
Complete filter criteria and logic
Step 34. Choose the operator or date option and enter the required value, minimum, maximum, or date-relative range.
Step 35. Use Is Not to exclude a value and Null to include records with no value when appropriate.
Step 36. Save the filter. Repeat for additional criteria and use AND, OR, and parentheses to control the evaluation order.
|
Important Parentheses change how filters using AND and OR are evaluated. Review the filter summary as a complete sentence and test the logic with known clients before using the report for official counts. |
Run the custom report
Step 37. Open Run Report.
Step 38. Enter Date From, Date Through, and Clinical Review Year when applicable.
Step 39. Select optional settings such as Show New Clients only, Show Clients with Service only, Show Specifications, or Sum Numeric Fields.
Step 40. Confirm Primary Provider, Group By Provider, and the selected provider domains.
Step 41. Choose Open in New Tab, PDF, CSV, CSV With Specs, or Save to My Reports.
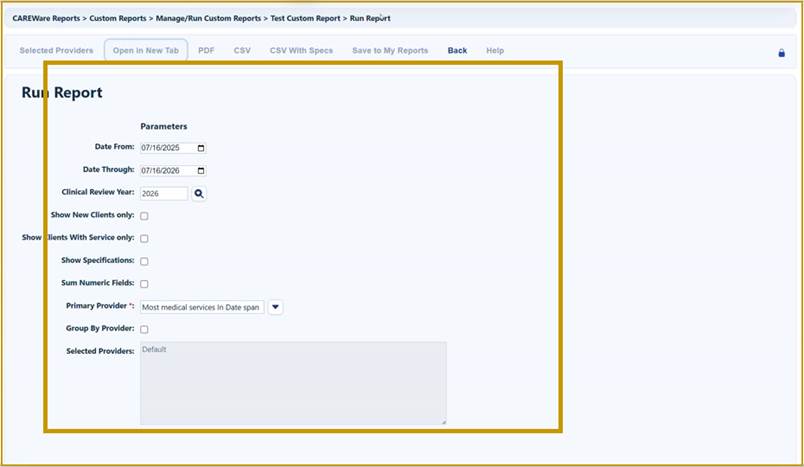
|
Important To include several providers, run the report from Central Administration and verify Selected Providers. Cross-provider field permissions and data-sharing settings can also affect which shared records appear. |
Review and validate the output
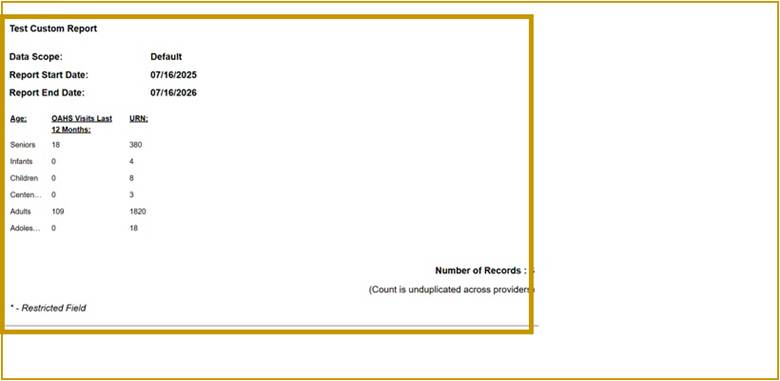
Step 42. Review the report title, data scope, date span, columns, categories, totals, and number of records.
Step 43. Compare the results with known client or record examples and revise fields, totals, subfilters, or report filters when necessary.
Run Report parameters
|
Parameter |
Effect on results |
|
Date From / Date Through |
Defines the reporting period used with the report type critical date and date-sensitive fields or filters. |
|
Show New Clients only |
Requires an enrollment date within the report date span. |
|
Show Clients with Service only |
Requires a service date within the report date span. |
|
Show Specifications |
Displays report criteria and critical-date information in the output. |
|
Sum Numeric Fields |
Adds totals for numeric output columns. |
|
Primary Provider |
Assigns a primary provider using the selected calculation for clients served by several providers. |
|
Group By Provider |
Separates the output under provider headings. |
|
Selected Providers |
Determines which provider domains are included. |
Date-span and critical-date guidance
The report type critical date determines which records are evaluated against Date From and Date Through. Date-sensitive fields and filters may also use the run date span or compare values to Date Through.
|
Report type |
Critical date or behavior |
|
ADAP Enrollment History |
ADAP Enrollment History Date |
|
Case Notes |
Case Notes Date |
|
Custom Subform |
Custom Subform Date |
|
Demographics |
Client-level output; date-sensitive options and fields still use the run parameters. |
|
Diagnosis |
Diagnosis Date |
|
Drug Service |
Service Date |
|
Eligibility |
Eligibility Date |
|
Insurance Assessment |
Insurance Assessment Date |
|
Lab |
Test Date |
|
Medication |
Medication Start Date / End Date |
|
Referrals |
Referral Date |
|
Relations |
Service Date |
|
Screening / Screening Lab |
Test Date |
|
Service |
Service Date |
|
Vital Signs |
Vital Sign Date |
The complete list is maintained in the official Custom Reports Field Descriptions guide.
|
Example An Eligibility report includes eligibility records whose Eligibility Date falls within the run date span. If Show Clients with Service only is also selected, the client must also have a service during that span. |
Copy, export, import, and reuse reports
- Use Copy Custom Reports in Central Administration to place a report definition in another provider domain.
- Use Export Custom Reports to save report definitions as portable XML before major changes or for transfer between environments.
- Use Import Custom Reports from an XML file to load a trusted report definition or a data-quality report supplied by jProg.
- A custom report can also support Form Designer controls or scheduled CSV report exports when those features are configured.
|
Warning Copying or importing a report definition does not copy user permissions, provider data, sharing settings, or identical field availability. Run and validate the report in each destination provider. |
How to confirm it worked
- The report opens without an incomplete field or filter status.
- The output contains the intended columns in the expected order and uses the correct date span and provider scope.
- Known clients or records are included or excluded exactly as the filter logic requires.
- Totals, crosstab percentages, and record counts agree with a small validated sample.
- Show Specifications accurately describes the report criteria when that option is selected.
Troubleshooting and common questions
Why is a field or filter not listed?
Confirm the Report Type, search term, Show/Hide Custom Report Fields settings, user permissions, and cross-provider report field permissions. Different report types expose different fields and filters.
Why does the report return no results?
Check Date From, Date Through, the report type critical date, report filters, field subfilters, selected providers, and whether Show New Clients only or Show Clients with Service only is selected.
Why is the same client listed more than once?
Record-based report types list one row for each matching record. Use Demographics for a client-level list, or use totals and grouping only after confirming the source rows.
Why did a template change the field list?
A Field Selection template can replace the fields already configured in the report. Restore the report from an exported custom report XML definition or rebuild the intended fields.
Why do the results change when Show Clients with Service only is selected?
That option adds a service-date requirement within the report date span. Clients who meet the main report criteria but have no service in the span are excluded.
Related CAREWare guides and resources
|
Resource |
How it helps |
|
Full reference for report types, permissions, setup, filters, critical dates, copying, and crosstabs. |
|
|
Detailed guidance for run parameters, selected domains, shared data, and provider grouping. |
|
|
Steps for adding and editing field or filter subfilters. |
|
|
Report definitions and examples used to identify RSR, ADR, and other data-quality issues. |
|
|
Provider permissions, data-sharing settings, and cross-provider report field access. |
|
|
Displays custom report results within a custom form. |
|
|
Schedules custom report output as a CSV file and defines provider data scope. |


